



Analytics
Ask a question about a table, get a chart you can keep
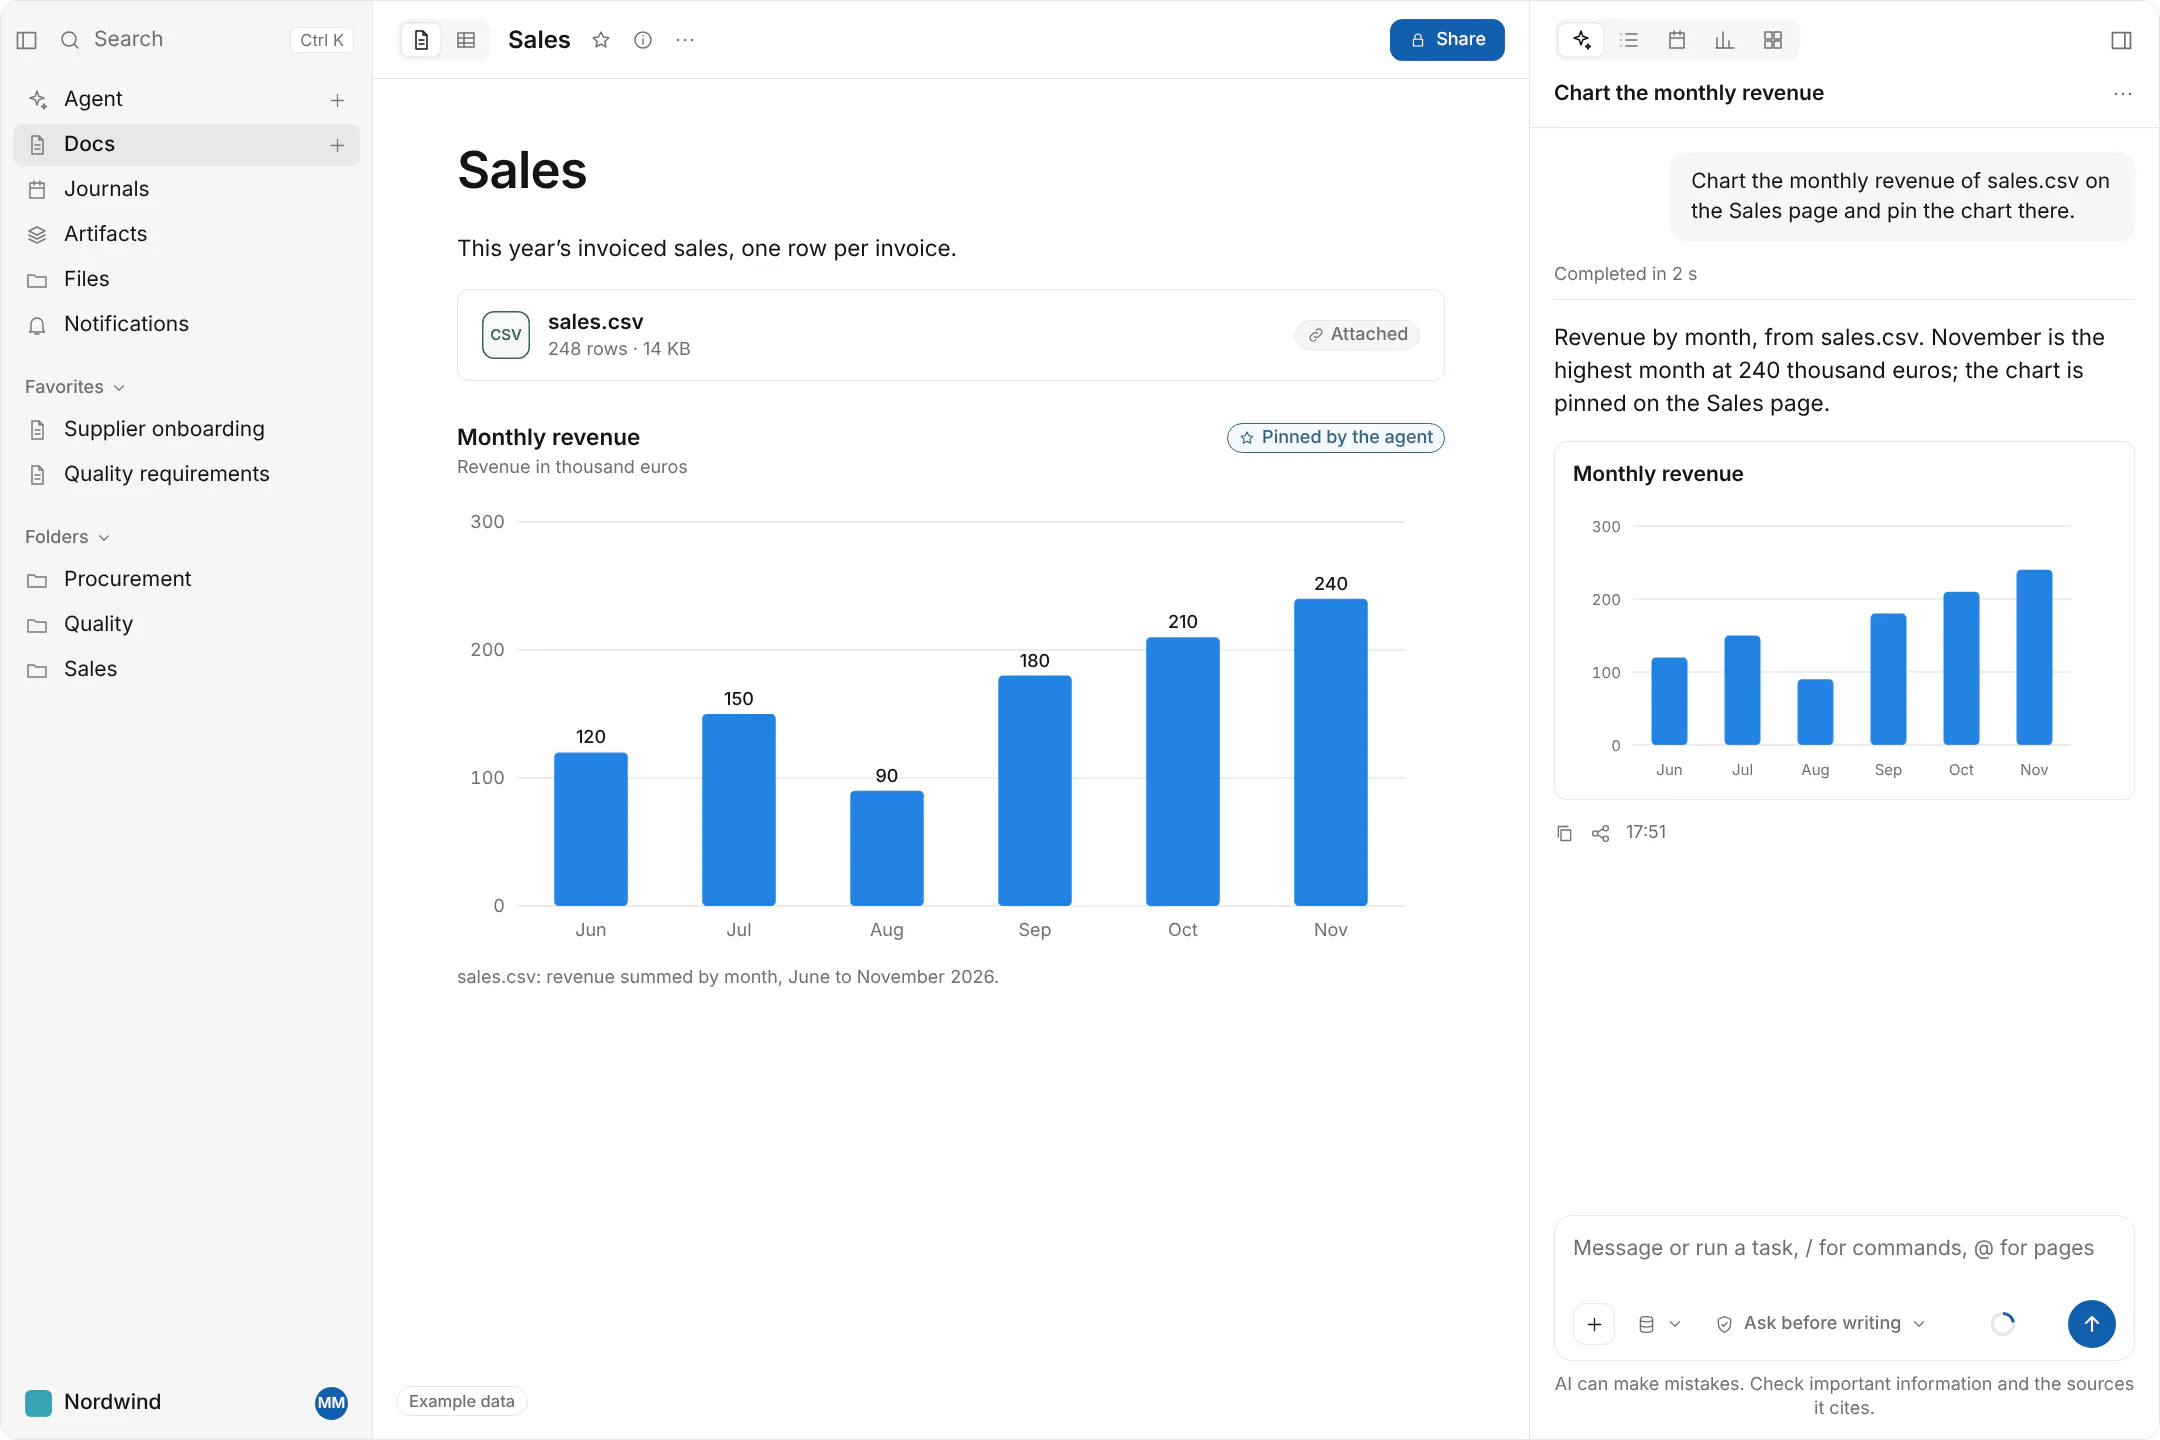
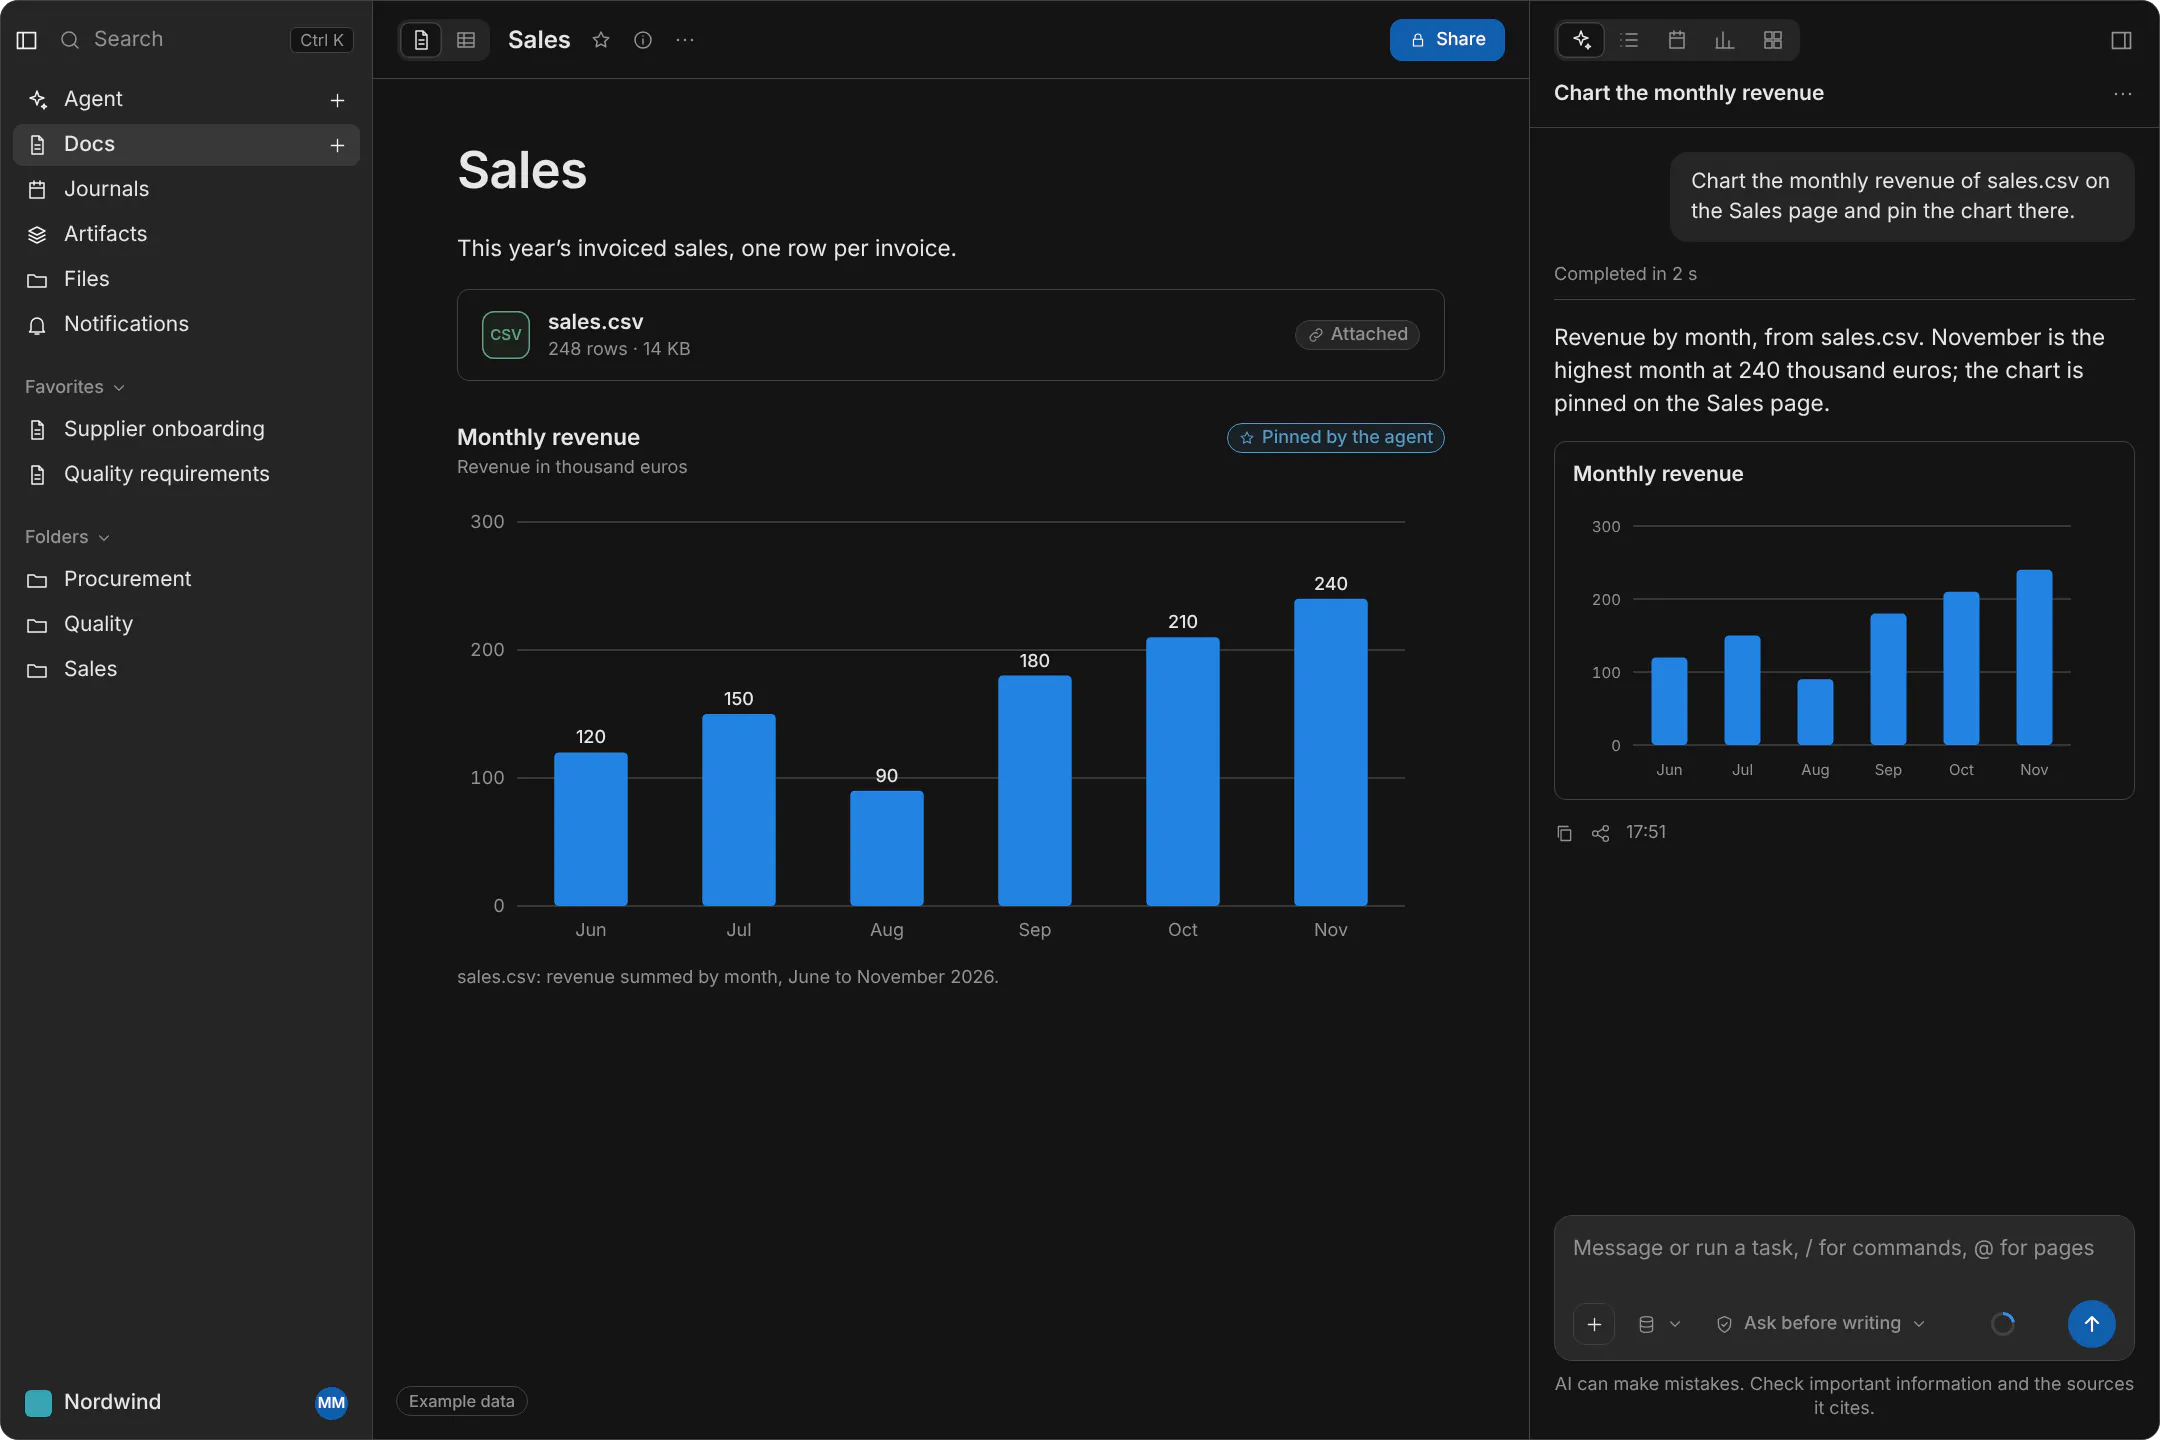
Ask a question about a table or a CSV file, and the agent answers with a chart that you can pin in a page.
From a question to a chart
Ask a question about a table in the workspace or about a CSV file you attach. The agent runs the analysis in a sandbox and answers with a chart.
- Tables and CSV files
- Analyses run in a sandbox
- A chart as the answer
Pin the chart in a page
A chart can be pinned in a page, so the people who read the page see the answer next to the text it belongs to.
- Charts pinned in pages
Small apps and reports you keep
The agent can build small apps and reports for you. They stay with you after the session has ended.
- Small apps built by the agent
- Reports built by the agent
Analytics in depth
These pages go deeper into analytics engineering and technical reasoning.
Ask your first question about a table
Start with a table of your own, or book a demo and we show it with your data.